| ORIGINAL
PAPERS
The
study
on the efficiency of
electromyographic biofeedback in the
posttraumatic recuperation of the knee Oraviţan
Mihaela
University
of West Timişoara, Sport and Physical Education Faculty
Abstract.
The
electromyographic biofeedback has been associated to the classical
protocol of recovery (consisting of physiotherapy and physical
therapy) on an experimental lotof
60 patients. The
efficiency of this method
that is relatively new in our country has been pointed out by
comparing the development of the patients part of the experimental
group with the development of the witness lot (66 patients) which
has been treated only by means of a kinetic program and physiotherapy
procedures.
The
comparison criteria were joint mobility (flexion and knee extension),
muscular force (of the quadriceps femoris) and the parameter of the
KOOS scale measured each month at all 126 patients monitored during
the 6 months.
The
statiscal analysis of the results shows that by combining the
electromyographic biofeedback with the classical recovery method
improves significantly most of the parameters monitored during
posttraumatic rehabilitation (joint mobility, muscle force, recovery
period). Key
words: electromyographic biofeedback,
rehabilitation, posttraumatic knee.
Introduction
The
knee is the joint that is mostly exposed during sports activities.
The treatment and the recovery of the posttraumatic injury
of this joint is submitted to complex protocols which have as final
objective the patient’s quick and best integration into the
activities performed before the trauma. This demand is obviously most
important for sportsmen. One of the quite new methods that have been
applied for some years in our country too is the one of the
electromyographic biofeedback which completes the classical recovery
protocols consisting of kinetic programs and physiotherapy procedures
adapted to the injury type, its severeness as well as to the
individual particularities of the patient (age, sports activity
before the trauma etc.) [2,3,10-14]. In this study I have tried to
highlight the advantages of the electromyographic biofeedback in
comparison to the classical recovery regarding the quality and the
rapidity of the recovery which crucial for sportsmen.
The
recovery after a posttraumatic injury of the knee has as main
objective the reduction or even elimination of posttraumatic
after-effects regardless of the applied orthopedic-surgical treatment
(ligament reconstruction, immobilization
by means of plaster cast etc.). Great emphasis is given to the
recovery of the quadriceps femoris. However, very often the specific
exercises are performed with great difficulties due to the
inflammations or to the post-surgical effects which occur within the
first days/weeks (edema, tumefaction, pain) and due to a possible
affection of the joints proprioceptors [7,10]. The feedback loop
which determines the proper functioning of the muscle is out-of-tune
as well as the facilitating or inhibiting influences which act
physiologically upon the musculature of the knee and the patterns of
the muscle contraction become less efficient. All these phenomena may
diminish the efficiency of the exercises applied within the recovery
program for the improvement of muscle control and muscle force [2,3].
Up to now, the electromyographic biofeedback has been applied with
great success in neurology [4], in the posttraumatic rehabilitation
of the hand, in shoulder instability [1], in case of posttraumatic
spine injuries and cerebral vascular injuries [4], after meniscus
injuries [11] and after the reconstruction of the cruciate
ligaments[2,3]. Material
and methodFor
this study I have chosen by random 126 patients which have been
classified into two lots: the experimental lot (EL: 60 patients) and
the whiteness lot (WL: 66 patients). The structure of both studied
lots is illustrated in table I and, as it can be noticed, it is
similar in what concerns the age, gender and injuries of the
patients). On both lots there have been applied classical recovery
protocols (consisting of specific kinetic programs,
hidrokinetotherapy, masage and physiotherapy).
For
the experimental lot
I have applied additionally the electromyographic biofeedback. I have
used a biofeedback and electrical stimulation apparatus Myomed 134
produced. Like most of the high-performance biofeedback apparatuses,
the Myomed 134 apparatus enables the setting of the recovery
protocols which will be selected by the therapist and applied
afterwards on various patients, depending on the status of the
injured knee, on the recovery stage and on the individual
particularities of each patient (this recovery method being known
also for its adaptability to the previously mentioned factors).
|
|
Table
I – studied lots
| Parameter
| Experimental
Lot |
Whiteness
Lot
| The
structure of the lot-
Total number
of
patients
- Patients of
feminine gender
- Patients of
masculine gender
- Medium ages
|
60 cases
30
cases
30 cases
29,2
years
|
66 cases
31
cases
35 cases
30,8
years |
Traumatic
injuries- III degree sprains
- Meniscus injury
- II
degree sprains
|
20 cases
18
cases
22
cases |
22 cases
20
cases
24 cases |
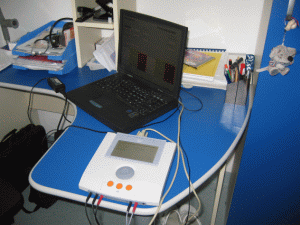
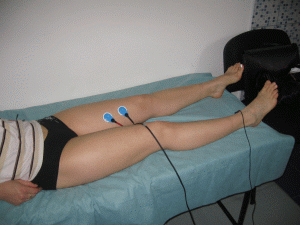
Figure
1,
a and b
a- Usage of
the Myomed 134 apparatus connected to the PC; on the PC monitor one
may observe a contraction-relaxation-stimulation protocol ;
b –
Electrodes on |
Table
II The
parameters of the protocols used during the study
| Protocol
| Therapy
| Submenu
| | 1
| EMG
| Contraction
5”/ relaxation 5” |
| 2
| EMG
| Contraction
7”/ relaxation5” |
| 3
| EMG
| Contraction
10”/relaxation5” |
| 4
| EMG
| Pattern
| | 5
| EMG
| Continuous
contraction | | 6 |
EMG
| Contraction
5” / Relaxation5” on 2 channels |
| 7
| EMG
| Pattern
on
two channels | | 8 |
EMG
+
Stimulation | Relaxation5”/
contraction 5” / stimulation 5” |
| 9
| EMG
+
Stimulation | Relaxation5”/contraction5”/stimulation
5” on 2 channels |
| 10 |
EMG
+
Stimulation | Stimulation
under the lower threshold value |
| 11
| EMG
+
Stimulation | Stimulation
over the lower threshold value |
|
|
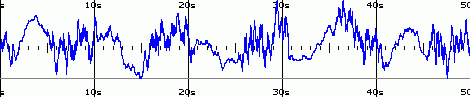
When
the apparatus is connected to the computer, the protocols may be
graphically illustrated showing clearly the different stages of the
protocol (contraction, relaxation, electrical-stimulation) (figure
1).
The
protocols selected for the patients recovery who suffered knee
traumas are illustrated in table II.
The
initiation of the recovery program by using the EMG biofeedback will
be made in dependence on the diagnostic, the patient’s state
and
its recovery stage. The first protocol from table (protocol
1) will
be used for most of the patients in
the preoperatory,
immediate posoperatory or post-immobilization stage. As the patient
will carry out a succession of contraction and relaxations of
5”
with the EMG approaching normal parameter it will be switched to a
more difficult protocol (protocols 2 and 3).
If
the patient doesn’t show contraindications regarding
electrotherapy, then the protocols 8-9 can be used in parallel to the
protocols 1-3. Thus in the initial stage of the recovery
protocol
8 (figure 3) and afterwards protocol 9. The
comparison
with the healthy lower membre is very important in the estimation of
the recovery level and may be carried out by means of EMG by
selecting 2 channels. This type of examination has been included in
the protocols 6 and 7 (figure 2).
Protocols
10 and 11 are meant exclusively for the
electrical-stimulation
via TENS.
The
patient will be first trained about the protocol to which he well be
submitted and will follow the execution of the therapist’s
indications respectively of the biofeedback apparatus.The
pattern type protocols (as in case of protocol 4 and 7) require the
adjustment of the apparatus in such way as to allow the patient to
make the contractions and relaxations which will be carried out
within certain limits set by the therapist. Some bars will be
displayed on the monitor (figure 2). Their widths (amplitude in
microvolts) are defined by the therapist according to the recovery
stage. Thus, when first using this type of protocol,
|
|
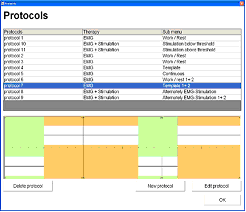
Fig.2
| 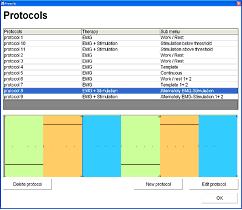
Fig.3
|
| Figure
2. The monitor of the PC in case of a
pattern protocol (protocol 7) |
Figure 3
The monitor of the PC
in case of a contraction / relaxation /
stimulation protocol (protocol 8) |
|
|
he
used ranges will be larger becoming more and more narrower once the
patient’s control over the contraction and relaxation
processes
increases. Generally, this type of protocol is used in later stages
of recuperation when the patient has already improved his neuromotor
control and is able to graduate the contraction process. The
protocols 8 and 9 combine the biofeedback process with the electrical
stimulation process via TENS; protocol 8 so as it is represented on
the PC’s monitor consists of 5 cycles of
contraction5”,
relaxation 5” and electrical stimulation 5”. The
electrical
stimulation is performed by means of low frequency currents
respectively through subcutaneous nerve stimulation (SNET or TENS
according to the internationally approved terminology).
Assessment
methods
The
elements that have been monitored on the patients were joint mobility
(flexion and knee extension though goniometry), the strength of the
thigh muscles (of the quadriceps femoris and of the
hamstrings through manual examination),
the
electrical potentials in contraction and relaxation at the quadriceps
femoris (assessed electromyographically by means of the Myomed 134
apparatus). Figures 4 and 5 illustrate two electromyographic pictures
of a patient in different recovery stages. |
|
Figure
4. EMG form for protocol No. 1 (contraction- relaxation) in
Microsoft Word
(Patient
S.C., 23 years, WL 35, 1 month postoperative) |
EN-Biofeedback
Enraf-Nonius
Statistics
global Channel 1Work
min 0 µV Work
max 16 µV Work
avr 8 µV Rest
min 0 µV Rest
max 13 µV Rest
avr 6 µV Work
Stand. Dev. 8,23 µV Rest
Stand. Dev. 6,38 µV Rising-time
0,49 s Drop-time
0,77 s
Figure 5.
EMG form for protocol No. 1 (contraction- relaxation) in
Microsoft Word
(Patient
S.C.., 23 years, WL 35 Status after anterior cruciate ligament
reconstruction, 3 month postoperative) |
EN-Biofeedback
Enraf-Nonius
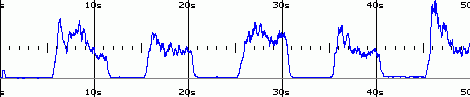
Statistics
global Channel 1
Work
min 0 µV
Work
max 58 µV
Work
avr 37 µV
Rest 0
µV
Rest
max 14 µV
Rest
avr 8 µV
Work
Stand. Dev. 9,92 µV
Rest
Stand. Dev. 3,27 µV
Rising-time
0,60 s
Drop-time
1,10 s
|
|
The
patients have been assessed each month also through the KOOS scale
Knee Injury and Osteoarthritis Outcome Score) by means of a set of 5
questions which were meant to asses the P-pain, S-other symptoms,
ADL-daily activities, PS- sport and recreational activities, QOL-life
quality. In
this study I have chosen the difference between the electrical
potential as parameter to be monitored because in my opinion it
comprises the progression of the contraction potential (the average
value of the electrical potentials during the contraction cycles from
within a protocol) as well as the potential from within the
relaxation (from within the same protocol). The
greater this difference is the grater is the neuromotor control of
the physiological processes specific to the monitored muscle as well
as the developed force. Furthermore, the average value of the
contraction potentials depends to some extent also on the reaction
time (rising-time), respectively on the time required starting from
the transmission of the visual or acoustic signal up to the
accomplishment of the contraction potential. The average value of the
electrical potentials from the relaxation period is also influenced
by the rapidness with which the muscle is able to relax (drop-time).
Generally, the general rule concerning the electrical potentials
collected from a joint is that in case of a muscular dysfunction
occurred at a certain movement, the spent energy is much greater than
in case of a healthy muscle, even if that movement is carried out
with a minimum of effort. In other words, in 95% of cases, the
amplitude of electrical potentials is greater in case of the
symptomatic muscles [365]. The same phenomenon occurs in case of
electrical potentials of pause. For this reason I have chosen to
estimate de difference of potential that includes both values.
Results
I
have established a statistical analysis of the quantifiable data of
all tests and assessments made within a time period of 6 months (time
period in which each patient has been monitored) and illustrated it
in form of the graphics 1-3. I have shown the parameters sensible to
the rehabilitation programs which are the objective translation of
the recovery stage of each patient, respectively of each lot.
On
the 6 main axes of the diagrams I have shown the progression of the
followings parameter: Active flexion
in the knee joint (FA – active
flexion); Quadriceps
femoris muscle force (FQ – quadriceps
force); The difference
between the medium electrical potential during the contraction of the
vast medial muscle and the electrical potential during relaxation
within a contraction/relaxation protocol (protocol 1) (DP –
potential
difference); Capacity to
carry out daily activities (ADL -
activities of daily living);
In
order to have a total evidence of the progression of these values,
they have been expressed in percentage compared to the physiological
values considered as usual for the respective parameter. The data
considered to be 100% for each monitored parameter are:
In
the cases in which the potential difference has shown a negative
result (the average electrical potential between the relaxation
periods was greater than the one from the contraction periods), which
may occur very often at the beginning of the rehabilitation, the
values have been considered void in order to be illustrated in the
upper diagrams and shown in the respective graphics. Considering
the fact that the values from the initial phases were alike, I found
it necessary, from a statistic point of view, to asses the
progression of the two lots WL and EL at an interval of 1 month, 3
months respectively 6 months |
|
Graphic
1
| 
Graphic 2
| Graphic
3
|
Graphics
1-3 The
compared progression of the parameters monitored as 1, 3,
respectively 6 months posttraumatic
Experimental
lot
Whitness
lot- ADL:
capacity to carry out every day activities
- SP:
capacity to carry out sport and recreational activities
- QOL:
life quality
- FA:
active flexion of the knee
- FQ:
quadriceps femoris force
- DP:
the difference of electrical potential between the
contraction and relaxation of quadriceps femoris
|
|
|
Discussions
The
results obtained from repeated assessments have been statistically
analyzed by using the test t impar and finally the correlation index
Pearson. The statistical analysis made between the progression of the
6 previously mentioned parameters are presented in the section that
follows.
The
above statistical analysis has allowed the following assessments: in
what concerns the evolution of the capacity to perform daily
physical activities, there are unsignificant differences
(p>0,05)
between the two lots; in other words, classical
recovery ensures enough rehabilitation for such activities within
the normal period limits of the patient (tabel III). Pursuing
the evolution of active mobility in the knee articulation
(active
flexion) has shown the fact that there are significant
differences(p<0,05))
between the two lots after
one month of starting the recovery and unsignificant
differences
after 3 and 6 months of starting it (p>0,05);
classical
recovery thus determines
enough recuperation to
recover active knee mobility, except for the initial recovery period
when electromyographic biofeedback has caused major changes (tabel
IV). In
regards of the evolution at the quadriceps femoris force there
are significant differences(p<0,05)
between
the two lots after only one month and after 3 months from starting
the recovery and extremely major differences 6
months after
having started this (p<0,001) (tabel
V); classical
recovery determines a less efficient rehabilitation like the one
where electromyographic biofeedback has been associated as a
complementary recovery method. This
difference is significantly bigger on a long term, considering that
the recovery of motor patternsthrough
biofeedback plays an
important
role in muscle force
recovery, along with the patient’s consciousness and direct
implication in the rehabilitation program. In
regards of the electrical potential difference at the
quadriceps
femoris (table VI)there are extremely
major
differences (p<0,001)between the
two lots, at one,
three and six months from starting the recovery.
Monitoring
the electrical potential difference at the quadriceps femoris has
allowed us a more precise quantification than the manual testing of
muscle force and has also allowed to consider the muscle relaxation
process, which is also affected in the initial recovery phases; the
certainty of a valid result is also given by making the average of
five contraction-relaxation cycles and including the latency times
necessary for these two muscle phenomena (almost of same importance
in the recovery process) to appear, into the calculation.
Statistical
analysis of SP evolution (table VII) has allowed us the following
assessments: in regards of the capacity to perform sports
activities or other recreational physical activities, emerges
the
fact that there are significant differences(p<0,05)
between the two lots, at 3 and 6 months from starting the
rehabilitation program and unsignificant differences
(p>0,05)
after one month; in other words,
the differences are minor, because the posttraumatic knee status only
allows performing a very short number of physical activities after
one month (and only the ones from the rehabilitation program), while
after 3 and 6 months, the differences between the two lots
becomesignificant, the EL showing higher values in KOOS score for SP.
In
table VIII the values of linear correlation Pearson factors are shown
together with the p probability values which prove the significance
of linear correlation. Studies have been performed upon the
correlations of DP values to FQ, SP and ADL for the EL lot at one
month, 3 months, 6 months and the average values obtained for these
time periods.
|
|
| ADL
| Atone month
| At3 months
| At6 months
| | Witness
lot | 75,44±9,99
| 94,19±4,53 |
99,28±2,45 |
| Experimental
lot | 73,67±10,54
| 94,1±4,96 |
99,53±1,05 |
| p |
0,3366 | 0,9179
| 0,4664 |
| Table
III.
Statistical analysis of ADL evolution between WL and EL |
|
FA
| Atone month
| At3 months
| At6 months
| | Witness
lot | 98,09±8,69
| 127,74±9,02 |
135,7±8,27
| | Experimental
lot | 101,02±7,42
| 126,87±10,21 |
137,4±8,53
| | p | 0,0437
| 0,6123 | 0,2582
|
| Table
IV.
Statistical analysis of range of motion evolution(active flexion)
for WL and EL |
| FQ
| Atone month
| At3 months
| At6 months
| | Witness lot
| 4,29±0,53 |
4,62±0,38 |
4,89±0,21 |
| Experimental
lot | 4,5±0,56
| 4,77±0,35 |
5±0,03 |
| p |
0,0317 | 0,0192
| 0,0002 |
| Table
V.
Statistical analysis of muscular force evolution for WL and
EL |
| DP
| Atone month
| At3 months
| At6 months
| | Witness
lot | -0,11±3,7
| 2,86±2,73 |
6,19±2,17 |
| Experimental
lot | 3,32±2,39
| 6,66±2,04 |
9,58±1,71 |
| p |
<0,001 | <0,001
| <0,001 |
Table
VI. Statistical analysis of DP evolution for EL and WL
|
| SP |
At
one month |
At
3 months |
At
6 months |
| Witness lot
| 37,42±17,83
| 62,58±27,22
| 97,58±4,14
| | Experimental
lot |
37,33±17,41
| 72,50±21,30
| 99,5±5,65
| | p
| 0,977
| 0,0238
| 0,0328
|
| Table
VII. Statistical analysis of SP evolution for EL and WL
|
| Coeficient
Pearson | At
one
month | At
3
months | At
6
months
|
Average
| | DP
cu FQ | 0,630
| 0,054
| -0,218
| 0,437
| | p | <0,001 | 0,679 | 0,0915 | 0,0254 |
| DP
cu SP | 0,110
| 0,514
| 0,523
| 0,102
| | p | 0,398 | 0,042 | 0,0312 | 0,274 |
| DP
cu ADL | 0,050
| 0,183
| -0,085
| 0,110
| | p |
0,702
| 0,158
| 0,515
| 0,217
|
Table
VIII.
Display of the correlation between followed parameters
|
|
|
The
conclusion of these results is that the average values of DP
(determined at the three time periods) with the average values FQ are
in a direct and significant average linear correlation (r=0,437,
p=0,0254). At one month, the correlation is direct and strong (r=0,63
cu p<0,001). DP
with SP at 3 and 6 months are correlated directly, significant and
average (r=0,514 at 3 months, respectively r=0,523 at 6 months, in
both cases p<0,05).
DP
with ADL show a unsignificant and very weak linear correlation.
The
statistical analysis of data obtained by articular, muscle,
electromyographic testing and by making the KOOS scale at different
intervals within the posttraumatic knee rehabilitation process has
allowed us to point out the fact that there is a significant
correlation between muscle testing evolution (realized by manual
testing of the quadriceps femoris and the electrical potential
difference measured by electromyography); this one is strong at one
month (confirming the hypothesis according to which the recovery of
neuro-motoric patterns, muscle coordination and muscle force as such
represent essential targets in posttraumatic knee recovery; this
correlation is even stronger for cases where surgical intervention
has been performed and where the posttraumatic disturbance has
obviously been greater.
The
weak linear correlation between DP and ADL confirms, if still
necessary, the idea that electromyographic biofeedback does not
influence in a significant way the obtaining of a “street
knee”,
being similarly performed for both lots, EL and WL; direct,
significant and average correlation between DP and SP confirm though
the hypothesis that electromyographic biofeedback contributes to a
faster reintegration into the previous sport activity. Conclusions
1.Electromyographic
biofeedback majorly changes muscle force recovery and, implicitly, the
electrical potential difference between contraction and relaxation of
the quadriceps femoris as compared to classical rehabilitation in all
the recuperation period phases, even if biofeedback training has only
been performed in the first two months. 2.Associating
electromyographic biofeedback to classical rehabilitation programs
significantly changes the capacity to perform sport and recreational
activities (at 3 and 6 months from starting rehabilitation), as well as
the knee mobility recovery speed in the first posttraumatic period.
3.Regain muscle
force, articular mobility and recuperation of neuro-motor coordination
are the base of sport activity reintegration as before the accident.
4.The advantages
of this method as opposed to other muscle force assessment techniques
are: - objectivity:
obtaining mathematical values transforms muscular contraction or
relaxation into perfectly quantifiable elements, which turns this
method into a very good monitoring means in posttraumatic recovery;
- the
response
to this investigation is spontaneous, clear and easy to see, surface
electromyography becomes the patient’s immediate response to
the
recuperation program;
- interpretation
is relatively easy, being sustained by the presence of an
interpretation program which can be used through PC connection;
- the
possibility to apply it in any recuperation phase, starting with the
preoperative phase (when necessary) and even postoperative or
posttraumatic phases
(in case of conservative treatment);
- relatively
high accessibility;
- continuous
possibility to compare with the counterlateral limb, which is
considered to be a reference value;
- this
method
ensures the progressive, quantified increase of the threshold value and
thus the control upon the progressiveness principle in the
rehabilitation process;
- the
method is
untraumatizing; it can be applied ambulatory, at the
patient’s home.
References:1.BEALL,
M.S., DIEFENBACH, G., ALLEN, A.(1987) -Electromyiographic biofeedback
in the treatment of volunteer posterior instability of the shoulder,
Am. J. Sports Med15: 175-178;
2.
DRAPPER ,V. ŞI COLAB.(1991) Electrical stimulation versus
electromyographic biofeedback in the recovery of quadriceps femoris
muscle function following anterior cruciate ligament surgery, Phis
Ther; 71 (6); 445-64; 3.
DRAPPER, V. (1990) Electromiographic biofeedback and recovery of
quadriceps femoris muscle
function following anterior cruciate ligament reconstruction, Phis
Ther, 70(1):11-17;
4.
NACHT, M.B., WOLF, S.L., COOGLER, C.E. (1982) Use of
electromyoographic biofeedback during the acute phase of spinal cord
injury, Phys Ther 62: 290-294;
5.
SELLA, G.E. (2002) Muscles in motion: Surface EMG
Analysis of
the Human Body Range od Motion,vol.
I, 3rd
Edition Revised, Martins Ferry, OH: Genmed Publishing, pp:231-238;
6.
SELLA, G.E.(2002) Muscular Dynamics:
Electromyography
Assesment of Energy and Motion, GenMed
Publishing,
Martins Ferry, OH, pp.320:345; 7.
SELLA, G.E.(2005) Muscular dysfunction: an SEMG
view of
investigation and rehabilitation of the lower limb muscles, OH,
Genmed Publishing, 2005; 8.
SELLA, G.E.(1999) SEMG of the Hip ROM Protocol: A study of
Consistency and Repeatability of Electrical Activity of 19 muscles,
Europa MedicoPhysica, vol.35, no.2.
pag.: 83-92; 9.
SELLA, G.E. (2001) SEMG: Muscular Assesment Reference Manual,
OH,
Genmed Publishing, pp:35-56; 10.
SODERBERG, G.L., COOK, T.M. (1983) An electromiographic analysis of
quadriceps femori muscle setting and straight leg raising, Phys
Ther, 1983, 63: 1434-1438;
11.SPRENGER,
C., CARLSON K., WESSMAN, H. (1979) Applications of electromyographic
feedback following medial meniscectomy, Phys Ther
59: 167-169
|
|
|
|